or is this closer to the truth.
Climate changes continuously. Ice age. Warm interglacial. Ice age. Warm interglacial and all at
‘normal, stable’ levels of CO2 according to Al Gore. So how did that happen if CO2 is the driver?
“It’s leading to heat waves, drought, sea-level rise, floods, superstorms, and other types of destructive, costly, and deadly extreme-weather events.”
And when hasn’t that been the case? When was the weather any different? To which year should we return?
You can find out about the Vegas climate here: http://www.wrh.noaa.gov/vef/climate/LasVegasClimateBook/index.php . But I am sure you knew that :). I didn’t either but it is amazing what you can find out by visiting skeptic websites(http://wattsupwiththat.com/2014/06/24/why-would-climate-skeptics-hold-a-conference-in-hot-las-vegas/).
The annual average max temps in Vegas show a slight downward trend while the record max temp shows no trend despite the record increase in CO2 our atmosphere has experienced over the last 60 years. The growth of Vegas has naturally contributed to its UHI. FYI, the year with the largest number of days with temps over 105F 1940 - 61. What does that say about the heat trapping superpowers of CO2?
For the country as a whole the number of hot days has been falling as CO2 concentration has been rising. What does that say about the heat trapping superpowers of CO2?
For the world there has been no continental high temperature record set since 1977 when CO2 was at a ‘safe, acceptable to an alarmist’ level below 350ppm. And yet, CO2 is now at 400ppm. What does that say about the heat trapping superpowers of CO2? In other words, temperatures have remained within the bounds of natural variation. There is nothing unprecedented about the warming of the late 20th century which is now in stasis.
Well, Frances, it didn’t make it to 110 during the conference in Vegas in 2014 although 104 was forecast and normal for the time of year. FYI, the year with the largest number of days with temps over 105F in Vegas - 1940 with 61. The year with the largest number of days with temps over 100F in Vegas was 1947 with 100. What does that say about the heat trapping superpowers of CO2? With 4.5 times the amount of CO2 pumped into the atmosphere over the last 60 years compared to the previous 60 years shouldn’t we expect these records to be reset on a fairly regular basis? Isn’t that a reasonable thing to expect from our CO2 blanket? Yes, I know, Vegas is but one city in a very big country in an even larger world. CO2 exercises its heat trapping abilities selectively then? How does that work?
As we slide along the 36th parallel over to Nashville, TN we find that it is cooler. Communities along the same line of latitude receive the same solar input to their atmosphere at the same time of year. Nashville is cooler than Lost Wages. Could it be because there is more water vapor in the air in Nashville? Now, interestingly, water vapor is another GHG and plays the multiplier, the amplifier, the partner in crime of carbon dioxide in the fictional climate drama presented in the global climate models. Water vapor is supposed to warm the planet even more as CO2 rises and causes more of it to evaporate into the atmosphere, yet it is cooler in Nashville. Negative feedback from H2O! Global climate models do not do clouds well. No wonder they continue to diverge from reality in an ever widening gap.
Frances, why do you say ‘carbon’ instead of carbon dioxide? Is it because CO2 is a trace gas essential to life on Earth and that would be a harder ‘sell’? Carbon conjures up images of dirty soot and ash(already regulated), the better to misinform you with?
Everyone wants clean air but I want mine with lots of CO2. There is a rumor that my fruits and veggies love the stuff and so do yours. CO2 was exhaled during the creation of this post. No living thing was harmed. Some even liked it.
Vegas and Nashville data
Vegas Latitude: 36 10’ N
Vegas: Elevation 2300’
Vegas Avg Humidity: 39%AM 21%PM
Nashville Latitude 36 9’ 58” N
Nashville: Elevation 600’
Nashville Avg Humidity: 83%AM 60%PM
Where was CO2 in that explanation? We didn’t need it.
But that was local climate and while CO2 may play little role in determining local climate how about regionally?
http://www.forbes.com/sites/jamestaylor/2014/06/25/government-data-show-u-s-in-decade-long-cooling/
The state of the art USCRN shows cooling. Fact. Shall we vote on that fact or suppress that fact? Why was the USCRN constructed? http://www.ncdc.noaa.gov/crn/
Has someone forgotten to turn on the heat trapping superpowers of CO2 in the world’s 2nd biggest emitter? At least the state of the art network provides confirmation of the decreasing trend which is apparent in the other major temperature datasets over the last decade. Or were until the data diddling picked up steam.
There are half as many 100 degree days now than there were in the 1930s. Is that what you would expect from a planet running a fever?
If we look at US State temperature records since recordkeeping began we find that most State maximum temperatures(Tmax) were set prior to 1960 and yet the big buildup in CO2 in the atmosphere has occurred since that time. During the ‘hottest decade ever’, 2000-2009, only 2 State maximums were reset - South Dakota and South Carolina. More State minimum temperatures(Tmin) have been set since the 1940s than State maximums.
Graph below. Don’t take my word for it. You have the data. Check it out for yourself.
Are those the results you would expect from a planet that has seen 4.5 times as much heat trapping CO2 enter the atmosphere over the last 60 years(1954-2013) compared to the previous 60 years(1894-1953)?
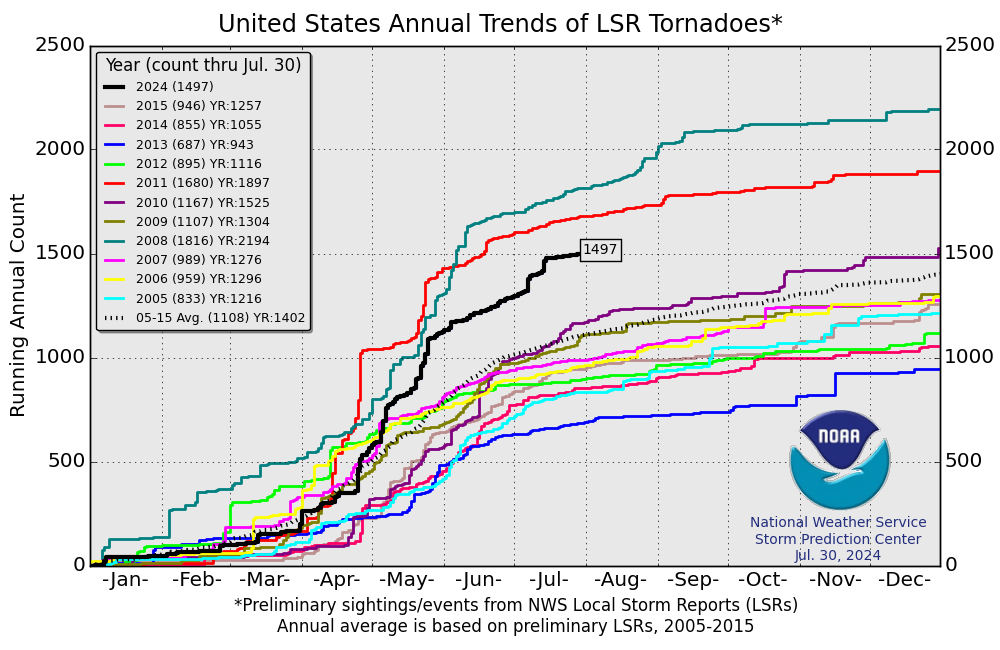
Let’s talk about tornadoes for a second. The US receives about 75% of all the world’s tornado visits so the US serves as both a regional test of the CO2 theory and also as a proxy for global data.
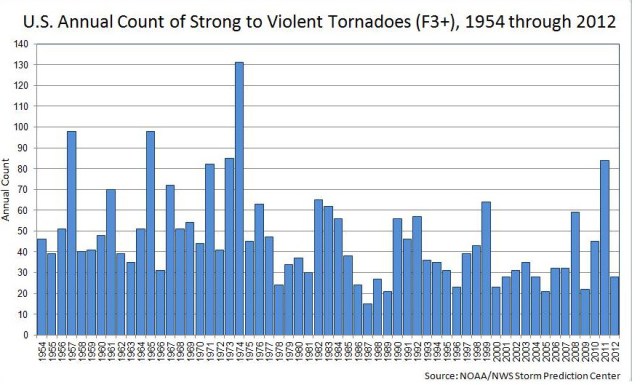
Tornadoes are classified according to the enhanced Fujita scale where an EF1 tornado is the weakest and an EF5 tornado is the strongest. The trend in major (EF3-EF5) tornadoes in the US since the great outburst in the 1970s has been down despite the rapid increase in human emissions of CO2 during the last 40 years.
With all that additional ‘heat energy trapping’ CO2 in the US air since 1925 how come the equivalent hasn’t reappeared? How come the record still stands? CO2 not working? Don’t worry climate alarmists. I am sure the climate gods will answer your prayers sooner or later. Records are made to be broken although in this case I hope Mother Nature takes a pass. Up to date data:
Certainly local and regional differences are expected but because of H2O not CO2. We are a water based world.
But OK, let’s do a global exercise.
The government datasets to do the calculations will be provided.
While in Hawaii in 2014 Al Gore had plenty of local plugs. He says the evidence on climate change first became clear from carbon dioxide emission monitors on top of Mauna Loa some 60 years ago.
So let’s compare 60 year periods.
If CO2 increased by 18 ppm and the Global Mean Temperature increased by .57C between 1894-1953(60 years) what would you expect the GMT to increase by in the following 60 years (1954-2013) if CO2 went up by 84 ppm?
1894-1953 18 ppm and .57C
1954-2013 84 ppm and ?.??C
That’s 4.5 times as much CO2 added in the last 60 years.
According to CAGW theory should ?.??C be larger or smaller than .57C? If larger, how much larger?
To check and verify use:
HADCRUT4 is an anomaly dataset so you are using the first two fields. There is a dataset on the site that explains the other fields(error bars) if you care to explore.
CO2 data post 1958
ftp://aftp.cmdl.noaa.gov/products/trends/co2/co2_annmean_mlo.txt.
Remember that the beginning of 1954 is the end of 1953 so you must use the 1953 figure to include all 60 years.
So, what was ?.??C for 1954-2013?
What conclusion would you draw from those data?
Do the math and connect the dots.
"We cannot order men to see the truth, or prohibit them from indulging in error"
~ Max Planck, 1936
I got .40C. Is that in the range that you would have expected?
Is this an example of the ‘unprecedented’ global warming we keep hearing about? We scare easy.
Disclaimer: just because CO2 changed and temperature increased DOES NOT MEAN that CO2 is the driver of that change. The other information presented above casts doubt on that connection.